-
675
Top Software Development Metrics & KPIs: Measuring Success
Key Software Development Metrics & KPIs are a way to measure a software development team’s productivity. It should be the primary concern of project managers. We will help you with metrics for measuring the development process if you haven't done it yet.
Getting the most out of your software development venture depends immensely on how you keep an eye on the process. Thanks to the software development metrics & KPIs, you can do it with no inconvenience. Let’s learn everything about software development performance metrics & KPIs and how they assist you in acing your software development!
Measuring a software development team’s productivity should be the primary concern of project managers. If you haven’t done it yet, it’s time to be serious about gauging the software development process. It not only lets you cut software development costs but also reduces the time associated with project development.
The software development metrics and KPIs are the ways using which you can measure the quantifiable characteristics of a software development project. The system is aimed at determining the quality of the project, planning for iterations, and seek for the feasibility of improvement.
No matter whether your company builds software or delivers services, a proper measurement of the project would always come in handy to squeeze optimal outcomes. Let’s learn about some of the software development performance metrics and how they can help you get there!
We have been helping organizations for almost a decade to streamline their business processes with top-notch web & mobile app development If you want to make a difference and build apps that help your team stay productive. We are just a few clicks away. Contact us today.
What Are Software Metrics?
In short, a software metric is a standard to measure software characteristics that are quantifiable. There are many types of software metrics that have many attributes to help you with planning the process, measuring software performance, productivity, and the like. There are a variety of metrics in a software development process that are all related to one another. In general, software metrics relate to the four management functions: Planning, Organization, Control, and Improvement.
Furthermore, having the right software development metrics enables you to perform many things, for instance, measuring code complexity, and productivity, while skyrocketing the project management process. As a result, with metrics to measure software development team performance, you’ll be able to spot where your team performs well, identify project bottlenecks, and mitigate risk to eliminate any chance of failure.
To get the best, you should prefer combining your management functionalities with software metrics to be able to design effective procedures, keep your team informed, plan for effective software maintenance, and simplify the software development process.
What Are Key Performance Indicators (KPIs)?
KPIs are a set of quantifiable measurements utilized to weigh an organization’s overall performance. Being specific, KPIs assist companies in ascertaining their strategic, financial achievements, operational metrics for software development, specifically in comparison to their competitors.
KPIs are also referred to as KPIs (key success indicators) and can differ depending on companies and industries based on their performance criteria. For instance, if a software company tries to embrace skyrocketing growth in the industry, it’s likely to consider YOY (year-over-year) revenue growth as its key performance indicator. In contrast to that, a retail chain might consider same-store sales as a preferred KPI metric for growth measurement.
Data collection, cleaning, storage, synthesizing, and so on lie at the root of KPIs, irrespective of whether the data is financial, non-financial, or from any industry or company. KPIs are aimed at communicating results briefly to enable management to make more informed decisions.
Why Should You Track Software Metrics?
Employing an actionable data strategy throughout the software development life cycle is an effective way to improve and innovate the way you develop software. Besides, being a product owner, you should have a look at your baseline data of the team working on the development project to experiment with the existing process and workflow. Let’s know the reasons why you should track software development metrics!
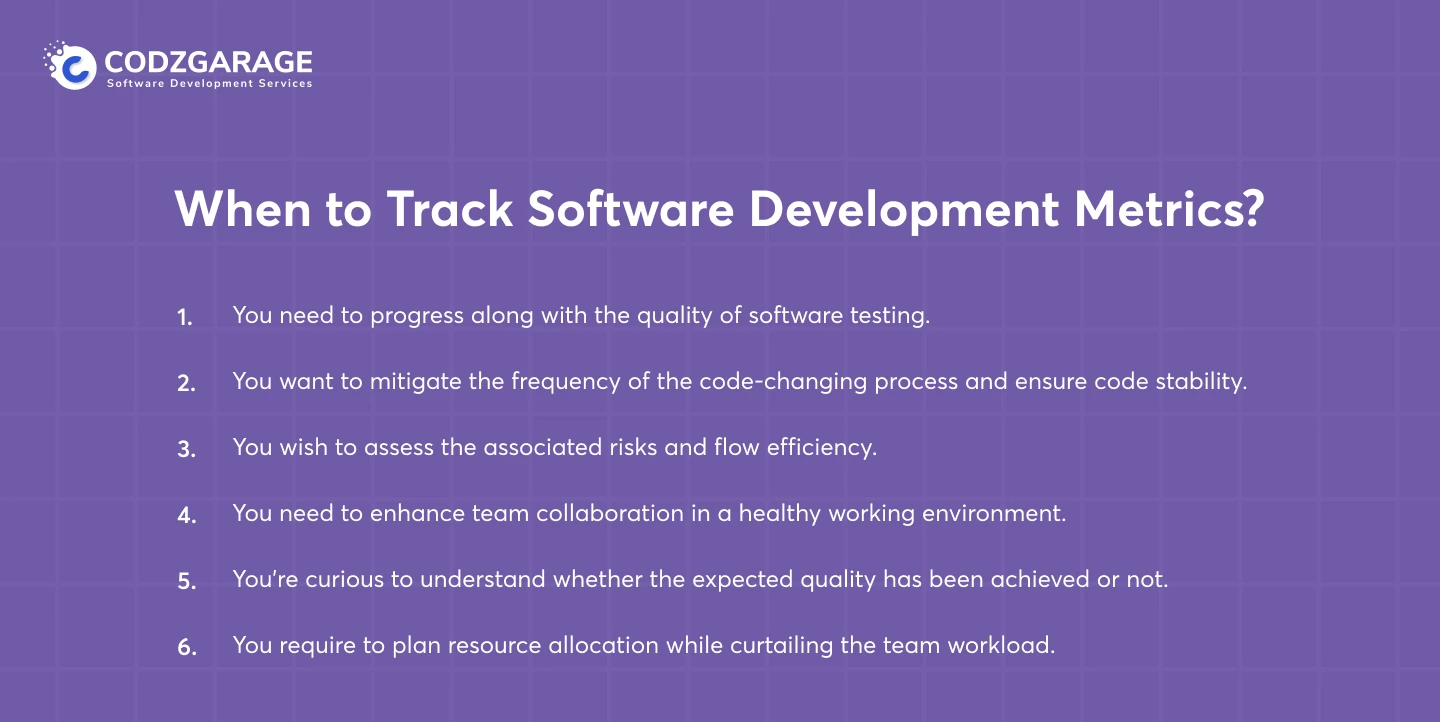
You should track software development performance metrics when_
- You need to progress along with the quality of software testing.
- You want to mitigate the frequency of the code-changing process and ensure code stability.
- You wish to assess the associated risks and flow efficiency.
- You need to enhance team collaboration in a healthy working environment.
- You’re curious to understand whether the expected quality has been achieved or not.
- You require to plan resource allocation while curtailing the team workload.
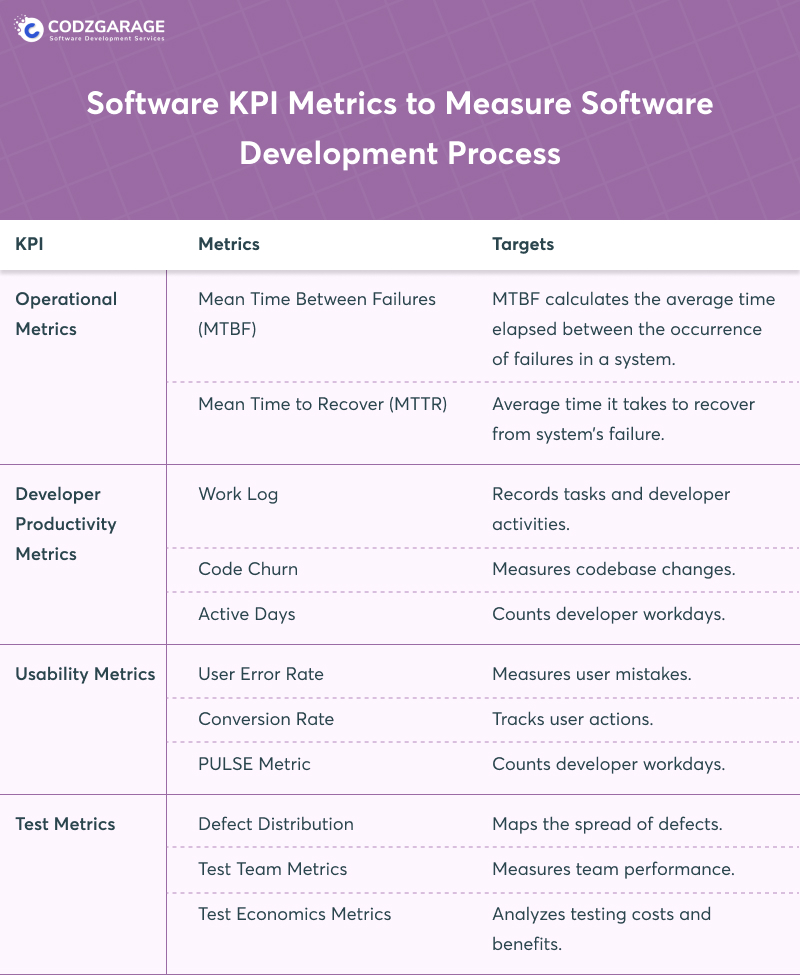
Excellent Software KPI Metrics to Measure Software Development Process
As of now, we’ve had a brief exploration of the basics of software development metrics; now it’s time we moved further. Let’s assess in detail and learn about the different types of software development metrics & KPIs to use and ace your product development!
Operational Metrics
Operational metrics function as key indicators enabling you to track your business’s real-time activities. By making use of operational metrics, you can enhance the efficiency that will be reflected in your project’s outcome. Furthermore, operational metrics gestures you how well your organization can execute its everyday work. Let’s know some of the well-known operational metrics using which you can track your operational efficiency!
Mean Time Between Failures (MTBF)
MTBF lets you know the overall time of the repairable issues in between software development. The longer time between unexpected outages, the more reliable the software will be. Furthermore, it assists performance metrics for cosoftware developers as well as software for how soon they occur and how soon they get resolved.
When MTBF calculation, you should consider dividing the whole operational hours in a day by the total number of failures— as MTBF, in general, is measured in hours. Let’s understand it with an example below! If the software product, in a specific year, is operational for around 3000 hours, and there are 20 unexpected outages in that software during that very year, here the MTBF will be like_ (3000 / 20 = 300 Hours). This tracking be known as software product development metrics.
Mean Time to Recover (MTTR)
MTTR lets you measure the mean time required to fix a failed software component. It calculates the duration between the very start of the incident and the time when the system goes to production. Besides, MTTR shows how soon a company can react to and troubleshoot accidental breakdowns. Utilize the formula below to calculate MTTR –
Suppose, for example, you spent 50 unplanned hours fixing the software that breaks down five times a year. In this case, your MTTR will be – (50 / 5 = 5 Hours.
Developer Productivity Metrics
Software developer metrics is another kind of measurement of a team’s capability to conveniently yield high-end software solutions. The method reveals a developer’s competencies and productivity during a specific time period or in certain criteria.
Take a glance at some of the well-known developer productivity metrics you can make use of_
- Work Log— The work log assists you in bringing significant insights based on data from merge commits, code commits, and both open/closed PRs and PR comments. A work log assists you in visualizing interpersonal dynamics as well as work patterns. Moreover, it provides you with accelerated momentum and streamlined delivery by giving you a hand in identifying the bottlenecks.
- Code Churn— Code churn is a kind of code that’s rewritten and deleted soon after getting created. It is a kind of metric that shows how often a specific piece of code gets edited. Code churn is proved to be inevitable when a developer struggles to create a given piece of code. In general, it happens because of lacking knowledge or lack of communication among team members.
- Active Days— Active days is another kind of software measurement that indicates any of the given days when an engineer created the code for the development.
Usability Metrics
Assume that you have got your app developed and users have signed it up, it’s software success metrics. But, they haven’t responded during the initial stages. Or, your app downloads got higher and higher soon after its launch. But again, you have no downloads as you expected. In the worst case scenario, that app is even uninstalled by users in just a matter of a few weeks.
If you employ excellent marketing and promotional strategies, getting to the next level of conversion is convenient and manageable. However, user engagement may be quite easy; when it comes to retaining those users and keeping them loyal to your application, it goes beyond marketing.
By knowing how to measure user experience, you’ll be able to get accurate data about how your users interact with your application. Apart from this, when you know how to measure user experience, you can be able to adjust your marketing as well as branding ventures intending to generate optimal outcomes. Here, you have the metrics that have the potential to help you assess user experience!
User Error Rate— The user error rate lets you know how many times a user makes a wrong input, for instance, the number of error opportunities. The user error rate creates more ways for enhancement in your software system, UI/UX design, and so on. A higher user error rate indicates a higher number of issues in usability. For example, users are more likely to commit errors when they try to type an email id. Without email validation, it’ll result in an error. Assume that if 5 out of a hundred users type a wrong email address, the user error rate will be like 5 / 100 * 100 = 5%
Conversion Rate— The conversion rate is the count of visitors on a specific website that accomplishes all the tasks, including making a purchase, filling out a contact form, and so on. Take it for an example, if 500 new visitors visit your website and merely 100 out of those visitors complete the signing up procedure, it indicates that there are spaces in your website to be improved and optimized for a better user experience.
PULSE Metric— The acronym PULSE stands for Page views, Uptime, Latency, Seven-day active users, and Earnings. This metric focuses on gauging the performance of an enterprise-grade software solution. The very metric indicates the business and technical aspects relating to the performance.
Have a closer look at the pointers below to see what these terms “Usability metrics” exactly mean!
- Page Views— It indicates the count of the total visitors to your site.
- Uptime— It reflects how many times a server is up and on the go.
- Latency— It shows the infrastructure performance of your website.
- Seven-Day Users— It indicates the competencies of your software to repeat users within seven days.
- Earnings— This one indicates the current state of your software, like whether it’s working or not.
Test Metrics
Now, we’ve Test metrics to discuss. These are crucial for agile teams, testers, and QA managers who wish to have advanced their testing capabilities. An excellent way to beautify your testing capabilities is by choosing a relevant test statistic, setting a baseline, and then analyzing the performance for the following few days, months, or even years.
- Defect Distribution— With defect distribution, you can have access to the very parts which are most vulnerable to defects. The defects here can be categorized according to the type, root cause, severity, module, functional areas, priority, testing environment, and the testers. You can simply make use of defect distribution charts that helps you understand, distribute, and recognize certain aspects for maximum defect removal. Pareto, or Pie charts, will likely assist you in tracking how your development venture should move on.
- Test Team Metrics— These metrics gauge the outputs and testing-related work allocation. It’s an excellent way using which you track the progress of units involved in software development. Apart from these, the test team metrics contain the distribution of defects found, defects allocated to each team member, and the defects returned per team member.
- Test Economics Metrics— The testing budget involves people, efforts, tools, and time. However, in terms of resource allocation, testing projects have limitations: hence, ascertaining how much you’re planning and how much you actually spend is inevitable. There are tools out there, including Cost per bug fix, Cost not testing, and Schedule Variance, which can be essential test economics metrics that offer significant insights to plan budgets. Furthermore, test economic metrics enable you to plan your budget for testing and evaluate the overall ROI of the testing.
Let’s understand these KPIs Metrics to measure software development process in brief.
Robust Software Development Agile Metrics That Could Make a Difference in Your Project
There are a variety of Agile metrics that help you assess, find out flaws, understand your workflow better, and streamline the project development and delivery time. This is something that allows your team to keep delivering value and satisfying customers constantly. Open/close rates, code coverages, lead, throughput, and cycle time, are some of the few basic agile metrics, if we name a few! These metrics allow businesses to prioritize and be more focused on specific business goals with no distractions. Here are some of the software application development metrics you should look at!
Cycle Time & Lead Time
Both lead time and cycle time are inevitable metrics. At the same time, cycle time refers to the time it takes a single process to get completed right from beginning to end. The lead time defines the time it takes for a process to get completed right from the beginning to the very end in its entirety— including all steps leading up to the final step in that process.
Code Coverage
The next one is Code coverage. It’s one of the key metrics for software development agile metrics with competencies to ascertain the count of lines of code validated in a test procedure. It enables software developers to ensure proper maintenance of the quality of codes. Furthermore, it offers the developers an interrupted exposure to the lower quality codes, ultimately maintaining a quality production of a high-end product.
Net Promoter Score
Net Promoter Score was created by management consultant Fred Reichheld dating back to the year 2003. It’s another development metric that’s focused on customer loyalty. It ascertains a crystal-clear, more accurate customer satisfaction ratio that can be compared over a variety of industries. Apart from that, the Net Promoter Score gauges up to what extent a respondent would be recommending a particular organization along with its products and services to their close ones.
Some of the Significant Software Development KPIs
The software performance mostly depends on the team’s productivity and members’ competencies to accomplish the given tasks in time. A competent set of software development KPIs, analyzed correctly, plays a significant role in building high-performance software with rich performance. Key metrics for software development or KPIs are the values that assist you in gauging the overall performance, showing how your development procedure is aligned with your business goals. Here are some of the high-end KPIs for software development!
Sprint Burndown Chart

One of the prominent software development measurement metrics is Sprint Burndown. It’s used by scrum teams for managing their development procedure. Moreover, it provides a graphical representation dictating how your project is progressing within the predetermined time, along with the amount of work to be completed during the iteration.
Learn how you can create an efficient burndown chart_
- Prepare a work management baseline using which you can make a comparison between planned and actual tasks.
- Conduct and accomplish a gap assessment based on inconsistencies.
- Gather information to use for sprint meetings in the future.
- Consider reallocating resources to accomplish print tasks in a set time frame.
The sprint burndown chart enables you to access updated reports on the project’s progress.
Release Burndown
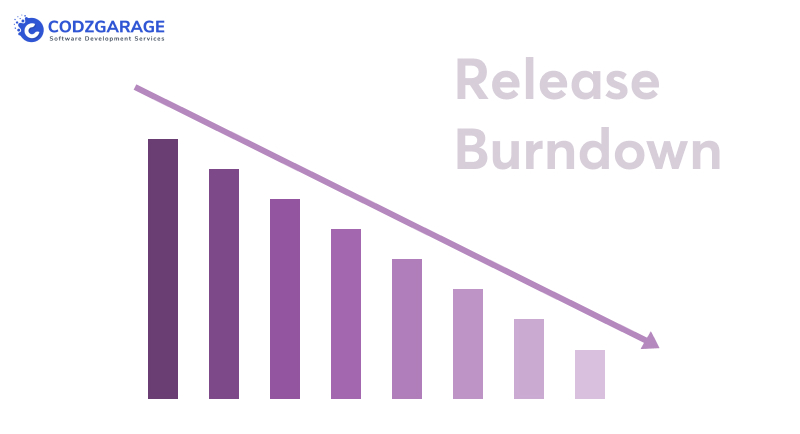
Release burndown, too, is a significant KPI for software development that takes notes of the whole release progress. Additionally, this metric assists team leads in guiding their members when they manage the release of the final products. When it comes to releasing burndown charts, the x-axis indicates sprints, whereas the y-axis represents story points.
You can make use of a release burndown chart to ascertain whether you are working as per schedule. Moreover, you’re likely to have accurate data to show the stakeholders when they expect an ROI post-release. Similarly to that, you can keep curious customers updated about delays or early releases.
Velocity
Last but not the least! Velocity indicates the amount of work accomplished by a team working on the sprint. There are numerous ways to measure the rate, and one of the popular ones is story points. This method evaluates a software product development overall size and the time to create it. Regardless of the size of your project, you’ll need three sprints in order to understand how rapidly your team can complete it. Furthermore, Velocity can also back you in estimating an overall development cost beforehand.
Signing Off…!
That’s all there’s to it! The software development teams are always looking for ways to speed up the development and delivery process. Poor development team KPIs lack an objective and a meaningful way of measuring their performance.
All the above-mentioned software development metrics are helpful when it comes to enhancing the development procedure customer experience, tracking development progress, reducing tech debt, and unleashing the ticks to improve the company’s growth.
Being a client-oriented IT firm, Codzgarage provides high-performance software development services to its clients across the world. From ideation to creation and consulting to migration, we’re the one-stop destination to extinguish your need related to digitization. We build software that blurs the gap between you and your customers!
Want
to Build Custom App?We Excel In
- Software Migration
- Web App
- Mobile App



 Kevin Bhut


